Checking the hydrological model
We found a high simulated peak and we dont understand where this peak comes from. The hydrological model output is stored in monthly resolution and does not contain all variables and states (to be able to handle storage). We therefore have re-simulated the model for the largest simulated event, so we could store and analyse multiple variables and states on a daily resolution. Note that the simulations are exactly the same, the only difference is the way the output is stored.
Import
##Load pacakages
import xarray as xr
import matplotlib.pyplot as plt
import numpy as np
import cartopy
import cartopy.crs as ccrs
import os
import matplotlib.ticker as mticker
##This is so variables get printed within jupyter
from IPython.core.interactiveshell import InteractiveShell
InteractiveShell.ast_node_interactivity = "all"
We load the catchment masks
##Load the catchment masks
masks=xr.open_dataset(r'/home/tike//EXPLORE/subCatchmentsAmazon.nc')
# masks_Ec=xr.open_dataset(dirname+'../EXPLORE/subCatchmentsAmazon_Ec.nc')
And we check which files are available for the re-simulated data
###Check which files are available for the re-simulated data
dirname = r'/home/tike/s13r13/netcdf/'
for filename in os.listdir(dirname):
    print (filename)
satDegLow_dailyTot_output.nc
directRunoff_dailyTot_output.nc
storGroundwater_dailyTot_output.nc
discharge_dailyTot_output.nc
totalWaterStorageThickness_dailyTot_output.nc
storLowTotal_dailyTot_output.nc
surfaceWaterStorage_dailyTot_output.nc
totalRunoff_dailyTot_output.nc
interflowTotal_dailyTot_output.nc
satDegUpp_dailyTot_output.nc
gwRecharge_dailyTot_output.nc
baseflow_dailyTot_output.nc
pr_d_ECEarth_PD_s13r13_2037.nc
storUppTotal_dailyTot_output.nc
waterBodyStorage_dailyTot_output.nc
totalEvaporation_dailyTot_output.nc
runoff_dailyTot_output.nc
We then load the relevant variables and states:
Discharge = xr.open_dataset(dirname + 'discharge_dailyTot_output.nc') #Streamflow
Discharge # m3/s

Runoff = xr.open_dataset(dirname + 'runoff_dailyTot_output.nc')
Runoff #m/d

Direct_runoff = xr.open_dataset(dirname + 'directRunoff_dailyTot_output.nc')
Direct_runoff #m/d

Baseflow = xr.open_dataset(dirname + 'baseflow_dailyTot_output.nc')
Baseflow #m/d

Groundwater_recharge = xr.open_dataset(dirname + 'gwRecharge_dailyTot_output.nc')
Groundwater_recharge #m/d


Groundwater_storage = xr.open_dataset(dirname + 'storGroundwater_dailyTot_output.nc')
Groundwater_storage  #m -> it says daily?

Storage = xr.open_dataset(dirname + 'totalWaterStorageThickness_dailyTot_output.nc')
Storage #m

### Variables not used
# totalRunoff_dailyTot_output.nc
# satDegLow_dailyTot_output.nc
# storLowTotal_dailyTot_output.nc
# surfaceWaterStorage_dailyTot_output.nc
# interflowTotal_dailyTot_output.nc
# satDegUpp_dailyTot_output.nc
# storUppTotal_dailyTot_output.nc
# waterBodyStorage_dailyTot_output.nc
# totalEvaporation_dailyTot_output.nc
- lat: 360
- lon: 720
- time: 1826
- time(time)datetime64[ns]2035-01-01 ... 2039-12-31
- standard_name :
- time
- long_name :
- Days since 1901-01-01
array(['2035-01-01T00:00:00.000000000', '2035-01-02T00:00:00.000000000', '2035-01-03T00:00:00.000000000', ..., '2039-12-29T00:00:00.000000000', '2039-12-30T00:00:00.000000000', '2039-12-31T00:00:00.000000000'], dtype='datetime64[ns]') - lat(lat)float3289.75 89.25 88.75 ... -89.25 -89.75
- long_name :
- latitude
- units :
- degrees_north
- standard_name :
- latitude
array([ 89.75, 89.25, 88.75, ..., -88.75, -89.25, -89.75], dtype=float32)
- lon(lon)float32-179.75 -179.25 ... 179.25 179.75
- standard_name :
- longitude
- long_name :
- longitude
- units :
- degrees_east
array([-179.75, -179.25, -178.75, ...,  178.75,  179.25,  179.75],
      dtype=float32)
- discharge(time, lat, lon)float32...
- standard_name :
- discharge
- long_name :
- discharge
- units :
- m3.s-1
[473299200 values with dtype=float32]
- description :
- Niko Wanders (n.wanders@uu.nl, nwanders@princeton.edu)
- institution :
- Utrecht University, Princeton University
- title :
- PCR-GLOBWB model output
- lat: 360
- lon: 720
- time: 1826
- time(time)datetime64[ns]2035-01-01 ... 2039-12-31
- standard_name :
- time
- long_name :
- Days since 1901-01-01
array(['2035-01-01T00:00:00.000000000', '2035-01-02T00:00:00.000000000', '2035-01-03T00:00:00.000000000', ..., '2039-12-29T00:00:00.000000000', '2039-12-30T00:00:00.000000000', '2039-12-31T00:00:00.000000000'], dtype='datetime64[ns]') - lat(lat)float3289.75 89.25 88.75 ... -89.25 -89.75
- long_name :
- latitude
- units :
- degrees_north
- standard_name :
- latitude
array([ 89.75, 89.25, 88.75, ..., -88.75, -89.25, -89.75], dtype=float32)
- lon(lon)float32-179.75 -179.25 ... 179.25 179.75
- standard_name :
- longitude
- long_name :
- longitude
- units :
- degrees_east
array([-179.75, -179.25, -178.75, ...,  178.75,  179.25,  179.75],
      dtype=float32)
- land_surface_runoff(time, lat, lon)float32...
- standard_name :
- land_surface_runoff
- long_name :
- land_surface_runoff
- units :
- m.day-1
[473299200 values with dtype=float32]
- description :
- Niko Wanders (n.wanders@uu.nl, nwanders@princeton.edu)
- institution :
- Utrecht University, Princeton University
- title :
- PCR-GLOBWB model output
- lat: 360
- lon: 720
- time: 1826
- time(time)datetime64[ns]2035-01-01 ... 2039-12-31
- standard_name :
- time
- long_name :
- Days since 1901-01-01
array(['2035-01-01T00:00:00.000000000', '2035-01-02T00:00:00.000000000', '2035-01-03T00:00:00.000000000', ..., '2039-12-29T00:00:00.000000000', '2039-12-30T00:00:00.000000000', '2039-12-31T00:00:00.000000000'], dtype='datetime64[ns]') - lat(lat)float3289.75 89.25 88.75 ... -89.25 -89.75
- long_name :
- latitude
- units :
- degrees_north
- standard_name :
- latitude
array([ 89.75, 89.25, 88.75, ..., -88.75, -89.25, -89.75], dtype=float32)
- lon(lon)float32-179.75 -179.25 ... 179.25 179.75
- standard_name :
- longitude
- long_name :
- longitude
- units :
- degrees_east
array([-179.75, -179.25, -178.75, ...,  178.75,  179.25,  179.75],
      dtype=float32)
- direct_runoff(time, lat, lon)float32...
- standard_name :
- direct_runoff
- long_name :
- direct_runoff
- units :
- m.day-1
[473299200 values with dtype=float32]
- description :
- Niko Wanders (n.wanders@uu.nl, nwanders@princeton.edu)
- institution :
- Utrecht University, Princeton University
- title :
- PCR-GLOBWB model output
- lat: 360
- lon: 720
- time: 1826
- time(time)datetime64[ns]2035-01-01 ... 2039-12-31
- standard_name :
- time
- long_name :
- Days since 1901-01-01
array(['2035-01-01T00:00:00.000000000', '2035-01-02T00:00:00.000000000', '2035-01-03T00:00:00.000000000', ..., '2039-12-29T00:00:00.000000000', '2039-12-30T00:00:00.000000000', '2039-12-31T00:00:00.000000000'], dtype='datetime64[ns]') - lat(lat)float3289.75 89.25 88.75 ... -89.25 -89.75
- long_name :
- latitude
- units :
- degrees_north
- standard_name :
- latitude
array([ 89.75, 89.25, 88.75, ..., -88.75, -89.25, -89.75], dtype=float32)
- lon(lon)float32-179.75 -179.25 ... 179.25 179.75
- standard_name :
- longitude
- long_name :
- longitude
- units :
- degrees_east
array([-179.75, -179.25, -178.75, ...,  178.75,  179.25,  179.75],
      dtype=float32)
- baseflow(time, lat, lon)float32...
- standard_name :
- baseflow
- long_name :
- baseflow
- units :
- m.day-1
[473299200 values with dtype=float32]
- description :
- Niko Wanders (n.wanders@uu.nl, nwanders@princeton.edu)
- institution :
- Utrecht University, Princeton University
- title :
- PCR-GLOBWB model output
- lat: 360
- lon: 720
- time: 1826
- time(time)datetime64[ns]2035-01-01 ... 2039-12-31
- standard_name :
- time
- long_name :
- Days since 1901-01-01
array(['2035-01-01T00:00:00.000000000', '2035-01-02T00:00:00.000000000', '2035-01-03T00:00:00.000000000', ..., '2039-12-29T00:00:00.000000000', '2039-12-30T00:00:00.000000000', '2039-12-31T00:00:00.000000000'], dtype='datetime64[ns]') - lat(lat)float3289.75 89.25 88.75 ... -89.25 -89.75
- long_name :
- latitude
- units :
- degrees_north
- standard_name :
- latitude
array([ 89.75, 89.25, 88.75, ..., -88.75, -89.25, -89.75], dtype=float32)
- lon(lon)float32-179.75 -179.25 ... 179.25 179.75
- standard_name :
- longitude
- long_name :
- longitude
- units :
- degrees_east
array([-179.75, -179.25, -178.75, ...,  178.75,  179.25,  179.75],
      dtype=float32)
- groundwater_recharge(time, lat, lon)float32...
- standard_name :
- groundwater_recharge
- long_name :
- groundwater_recharge
- units :
- m.day-1
[473299200 values with dtype=float32]
- description :
- Niko Wanders (n.wanders@uu.nl, nwanders@princeton.edu)
- institution :
- Utrecht University, Princeton University
- title :
- PCR-GLOBWB model output
- lat: 360
- lon: 720
- time: 1826
- time(time)datetime64[ns]2035-01-01 ... 2039-12-31
- standard_name :
- time
- long_name :
- Days since 1901-01-01
array(['2035-01-01T00:00:00.000000000', '2035-01-02T00:00:00.000000000', '2035-01-03T00:00:00.000000000', ..., '2039-12-29T00:00:00.000000000', '2039-12-30T00:00:00.000000000', '2039-12-31T00:00:00.000000000'], dtype='datetime64[ns]') - lat(lat)float3289.75 89.25 88.75 ... -89.25 -89.75
- long_name :
- latitude
- units :
- degrees_north
- standard_name :
- latitude
array([ 89.75, 89.25, 88.75, ..., -88.75, -89.25, -89.75], dtype=float32)
- lon(lon)float32-179.75 -179.25 ... 179.25 179.75
- standard_name :
- longitude
- long_name :
- longitude
- units :
- degrees_east
array([-179.75, -179.25, -178.75, ...,  178.75,  179.25,  179.75],
      dtype=float32)
- groundwater_storage(time, lat, lon)float32...
- standard_name :
- groundwater_storage
- long_name :
- non_fossil_groundwater_storage
- units :
- m
[473299200 values with dtype=float32]
- description :
- Niko Wanders (n.wanders@uu.nl, nwanders@princeton.edu)
- institution :
- Utrecht University, Princeton University
- title :
- PCR-GLOBWB model output
- lat: 360
- lon: 720
- time: 1826
- time(time)datetime64[ns]2035-01-01 ... 2039-12-31
- standard_name :
- time
- long_name :
- Days since 1901-01-01
array(['2035-01-01T00:00:00.000000000', '2035-01-02T00:00:00.000000000', '2035-01-03T00:00:00.000000000', ..., '2039-12-29T00:00:00.000000000', '2039-12-30T00:00:00.000000000', '2039-12-31T00:00:00.000000000'], dtype='datetime64[ns]') - lat(lat)float3289.75 89.25 88.75 ... -89.25 -89.75
- long_name :
- latitude
- units :
- degrees_north
- standard_name :
- latitude
array([ 89.75, 89.25, 88.75, ..., -88.75, -89.25, -89.75], dtype=float32)
- lon(lon)float32-179.75 -179.25 ... 179.25 179.75
- standard_name :
- longitude
- long_name :
- longitude
- units :
- degrees_east
array([-179.75, -179.25, -178.75, ...,  178.75,  179.25,  179.75],
      dtype=float32)
- total_thickness_of_water_storage(time, lat, lon)float32...
- standard_name :
- total_thickness_of_water_storage
- long_name :
- total_thickness_of_water_storage
- units :
- m
[473299200 values with dtype=float32]
- description :
- Niko Wanders (n.wanders@uu.nl, nwanders@princeton.edu)
- institution :
- Utrecht University, Princeton University
- title :
- PCR-GLOBWB model output
In addition, we load the precipitation and bias corrected precipitation data
##Load precipitation data for the flood
Start_flood1,Year_flood1,Ensemble_flood1, variable = [13,2037,13,'pr']
Precipitation = xr.open_dataset(r'/home/tike/Ec_data/' + variable + '/S' + '%02d' % Start_flood1 + '/' + variable + '_m_ECEarth_PD_s' + '%02d' % Start_flood1 + 'r'  + '%02d' % Ensemble_flood1 + '_' + '%04d' %Year_flood1 + '.nc')
Precipitation = Precipitation['pr'].sel(time='2037-07-16')/31 ##m/d
Precipitation.attrs={'long_name': 'EC-Earth precipitation',
 'units': 'm/d',
 'grid_type': 'gaussian',
 'short_name': 'pr'}
Precipitation
## Bias corrected precipitation
Precip_biascor = xr.open_dataset(dirname + 'pr_d_ECEarth_PD_s13r13_2037.nc') #Streamflow
Precipitation_biascor = Precip_biascor['pr'].sel(time=slice('2037-07-01','2037-08-01')).mean('time')
Precipitation_biascor.attrs={'long_name': 'Bias corrected precipitation',
 'units': 'm/d',
 'short_name': 'pr'}
Precipitation_biascor
- time: 1
- lat: 160
- lon: 320
- 0.0014859589 0.0014912853 0.0014966117 ... 0.0001591007 0.00015935538
array([[[0.00148596, 0.00149129, 0.00149661, ..., 0.00146513, 0.00147207, 0.00147902], [0.00126342, 0.00126648, 0.00126954, ..., 0.00122361, 0.00123688, 0.00125015], [0.00116569, 0.00118065, 0.00119562, ..., 0.00110212, 0.00112331, 0.0011445 ], ..., [0.00015527, 0.00015763, 0.00016 , ..., 0.00015064, 0.00015218, 0.00015373], [0.00016086, 0.00016127, 0.00016167, ..., 0.00015947, 0.00015993, 0.00016039], [0.00015961, 0.00015946, 0.00015931, ..., 0.00015885, 0.0001591 , 0.00015936]]], dtype=float32) - lon(lon)float640.0 1.125 2.25 ... 357.8 358.9
- standard_name :
- longitude
- long_name :
- longitude
- units :
- degrees_east
- axis :
- X
array([ 0. , 1.125, 2.25 , ..., 356.625, 357.75 , 358.875])
- lat(lat)float6489.14 88.03 86.91 ... -88.03 -89.14
- standard_name :
- latitude
- long_name :
- latitude
- units :
- degrees_north
- axis :
- Y
array([ 89.141519, 88.029429, 86.910771, 85.790629, 84.669924, 83.548947, 82.427818, 81.306595, 80.18531 , 79.063982, 77.942624, 76.821243, 75.699844, 74.578432, 73.457008, 72.335576, 71.214136, 70.09269 , 68.97124 , 67.849784, 66.728326, 65.606864, 64.485399, 63.363932, 62.242462, 61.120991, 59.999518, 58.878044, 57.756569, 56.635092, 55.513614, 54.392135, 53.270655, 52.149175, 51.027694, 49.906212, 48.784729, 47.663246, 46.541763, 45.420279, 44.298794, 43.177309, 42.055824, 40.934338, 39.812852, 38.691366, 37.56988 , 36.448393, 35.326906, 34.205418, 33.083931, 31.962443, 30.840955, 29.719467, 28.597979, 27.476491, 26.355002, 25.233514, 24.112025, 22.990536, 21.869047, 20.747558, 19.626069, 18.50458 , 17.383091, 16.261601, 15.140112, 14.018622, 12.897133, 11.775643, 10.654153, 9.532664, 8.411174, 7.289684, 6.168194, 5.046704, 3.925215, 2.803725, 1.682235, 0.560745, -0.560745, -1.682235, -2.803725, -3.925215, -5.046704, -6.168194, -7.289684, -8.411174, -9.532664, -10.654153, -11.775643, -12.897133, -14.018622, -15.140112, -16.261601, -17.383091, -18.50458 , -19.626069, -20.747558, -21.869047, -22.990536, -24.112025, -25.233514, -26.355002, -27.476491, -28.597979, -29.719467, -30.840955, -31.962443, -33.083931, -34.205418, -35.326906, -36.448393, -37.56988 , -38.691366, -39.812852, -40.934338, -42.055824, -43.177309, -44.298794, -45.420279, -46.541763, -47.663246, -48.784729, -49.906212, -51.027694, -52.149175, -53.270655, -54.392135, -55.513614, -56.635092, -57.756569, -58.878044, -59.999518, -61.120991, -62.242462, -63.363932, -64.485399, -65.606864, -66.728326, -67.849784, -68.97124 , -70.09269 , -71.214136, -72.335576, -73.457008, -74.578432, -75.699844, -76.821243, -77.942624, -79.063982, -80.18531 , -81.306595, -82.427818, -83.548947, -84.669924, -85.790629, -86.910771, -88.029429, -89.141519]) - time(time)datetime64[ns]2037-07-16T12:00:00
- standard_name :
- time
- bounds :
- time_bnds
array(['2037-07-16T12:00:00.000000000'], dtype='datetime64[ns]')
- long_name :
- EC-Earth precipitation
- units :
- m/d
- grid_type :
- gaussian
- short_name :
- pr
- lat: 360
- lon: 720
- 0.0011171534 0.0011171527 0.0011103832 ... 0.0006968823 0.00069688243
array([[0.00111715, 0.00111715, 0.00111038, ..., 0.00111862, 0.00111991, 0.00111991], [0.00108417, 0.00107514, 0.0010679 , ..., 0.00108463, 0.00108655, 0.00108733], [0.0010632 , 0.00105866, 0.00105412, ..., 0.00107279, 0.00107091, 0.00106958], ..., [0.00063694, 0.0006386 , 0.00064018, ..., 0.00063148, 0.00063315, 0.00063511], [0.00066979, 0.00066769, 0.0006662 , ..., 0.00066196, 0.00066592, 0.00066873], [0.00069784, 0.00069784, 0.00069871, ..., 0.00069583, 0.00069688, 0.00069688]], dtype=float32) - lat(lat)float3289.75 89.25 88.75 ... -89.25 -89.75
- long_name :
- latitude
- units :
- degrees_north
- standard_name :
- latitude
array([ 89.75, 89.25, 88.75, ..., -88.75, -89.25, -89.75], dtype=float32)
- lon(lon)float32-179.75 -179.25 ... 179.25 179.75
- standard_name :
- longitude
- long_name :
- longitude
- units :
- degrees_east
array([-179.75, -179.25, -178.75, ...,  178.75,  179.25,  179.75],
      dtype=float32)
- long_name :
- Bias corrected precipitation
- units :
- m/d
- short_name :
- pr
We load the masks and pre-process the discharge and runoff variables
mask_Amazon = (masks['Amazon']==1).squeeze('time')# USE squeeze!! instead of drop
mask_Xingu = (masks['Xingu']==1).squeeze('time')# USE squeeze!!
mask_Tapajos = (masks['Tapajos']==1).squeeze('time')# USE squeeze!!
discharge = Discharge['discharge'].sel(time=slice('2037-07','2037-08')).where(mask_Amazon).mean('time')
discharge.attrs={'long_name': 'Discharge',
 'units': 'm3/s'}

runoff = Direct_runoff['direct_runoff'].sel(time=slice('2037-07','2037-08')).where(mask_Amazon).mean('time')
runoff.attrs={'long_name': 'Direct runoff',
 'units': 'm/d'}
/home/tike/miniconda3/envs/exp/lib/python3.8/site-packages/xarray/core/nanops.py:142: RuntimeWarning: Mean of empty slice
  return np.nanmean(a, axis=axis, dtype=dtype)
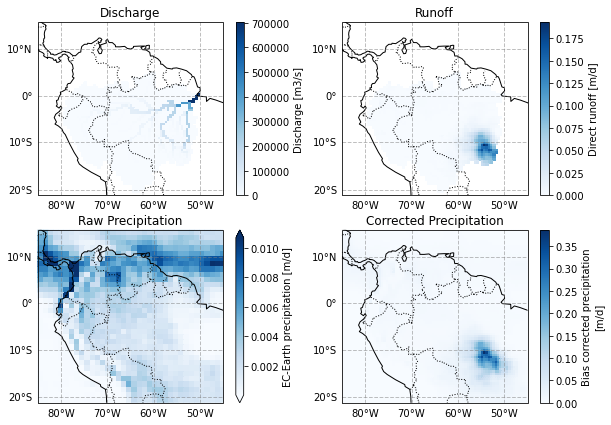
And then we plot!
fig, axs = plt.subplots(2, 2,figsize=(10,7),subplot_kw={'projection': ccrs.Mercator()})

discharge.plot.pcolormesh(ax=axs[0, 0],transform=ccrs.PlateCarree(),cmap=plt.cm.Blues)
runoff.plot.pcolormesh(ax=axs[0, 1],transform=ccrs.PlateCarree(),cmap=plt.cm.Blues)
Precipitation.plot(ax=axs[1, 0], robust = True, transform=ccrs.PlateCarree(),cmap=plt.cm.Blues)
Precipitation_biascor.plot.pcolormesh(ax=axs[1, 1],  transform=ccrs.PlateCarree(),cmap=plt.cm.Blues)


titles = ['Discharge', 'Runoff', 'Raw Precipitation', 'Corrected Precipitation']

for i, ax in enumerate(axs.flat):
    ax.set_title(titles[i])
    ax.set_extent([-85, -45, 15, -20])
    ax.coastlines(resolution='110m')
    ax.add_feature(cartopy.feature.BORDERS, linestyle=':')
    gl = ax.gridlines(
        crs=ccrs.PlateCarree(),
        draw_labels=True,
        linewidth=1,
        color='gray',
        alpha=0.5,
        linestyle='--')
    gl.xlabels_top  = False
#     if i not in [0,3,6,9]:
#         gl.ylabels_left = False
#     if i not in [9,10,11]:
#         gl.xlabels_bottom = False
    gl.ylabels_right = False
    gl.ylocator = mticker.FixedLocator(np.arange(-20,30,10))
    gl.xlocator = mticker.FixedLocator(np.arange(-90,-30,10))


# Runoff.where((masks['Amazon']==1).drop('time')).plot(ax=axs[1, 0],transform=ccrs.PlateCarree(),cmap=plt.cm.Blues)
plt.savefig('../Graphs/paper/Flood_source.png', dpi=300)
<matplotlib.collections.QuadMesh at 0x2acb57650c70>
<matplotlib.collections.QuadMesh at 0x2acb57650d30>
<matplotlib.collections.QuadMesh at 0x2acb5774feb0>
<matplotlib.collections.QuadMesh at 0x2acb57817070>
Text(0.5, 1.0, 'Discharge')
<cartopy.mpl.feature_artist.FeatureArtist at 0x2acb57860d90>
<cartopy.mpl.feature_artist.FeatureArtist at 0x2acb5262f760>
Text(0.5, 1.0, 'Runoff')
<cartopy.mpl.feature_artist.FeatureArtist at 0x2acb5262faf0>
<cartopy.mpl.feature_artist.FeatureArtist at 0x2acb5262f910>
Text(0.5, 1.0, 'Raw Precipitation')
<cartopy.mpl.feature_artist.FeatureArtist at 0x2acb57633d00>
<cartopy.mpl.feature_artist.FeatureArtist at 0x2acb5262fe20>
Text(0.5, 1.0, 'Corrected Precipitation')
<cartopy.mpl.feature_artist.FeatureArtist at 0x2acb5262feb0>
<cartopy.mpl.feature_artist.FeatureArtist at 0x2acb52656460>
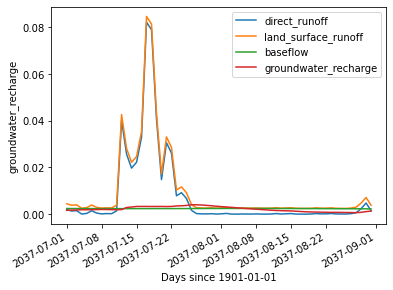
We also plot the fluxes and states averaged over the Amazon basin
Direct_runoff['direct_runoff'].sel(time=slice('2037-07','2037-08')).where(mask_Amazon).mean(['lat','lon']).plot(label='direct_runoff')
Runoff['land_surface_runoff'].sel(time=slice('2037-07','2037-08')).where(mask_Amazon).mean(['lat','lon']).plot(label='land_surface_runoff')
Baseflow['baseflow'].sel(time=slice('2037-07','2037-08')).where(mask_Amazon).mean(['lat','lon']).plot(label='baseflow')
Groundwater_recharge['groundwater_recharge'].sel(time=slice('2037-07','2037-08')).where(mask_Amazon).mean(['lat','lon']).plot(label='groundwater_recharge')
plt.legend()
plt.show()
plt.savefig('../Graphs/paper/Flood_source_fluxes.svg', dpi=300)
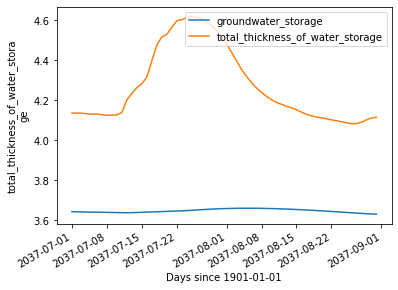
Groundwater_storage['groundwater_storage'].sel(time=slice('2037-07','2037-08')).where(mask_Amazon).mean(['lat','lon']).plot(label='groundwater_storage')
Storage['total_thickness_of_water_storage'].sel(time=slice('2037-07','2037-08')).where(mask_Amazon).mean(['lat','lon']).plot(label='total_thickness_of_water_storage')
plt.legend()
plt.savefig('../Graphs/paper/Flood_source_storage.svg', dpi=300)
[<matplotlib.lines.Line2D at 0x2b15e0c6f9a0>]
[<matplotlib.lines.Line2D at 0x2b15e0ca1970>]
[<matplotlib.lines.Line2D at 0x2b15e0c9bee0>]
[<matplotlib.lines.Line2D at 0x2b15e0ca1e80>]
<matplotlib.legend.Legend at 0x2b15e0c9b5e0>
[<matplotlib.lines.Line2D at 0x2b15e0cd3400>]
[<matplotlib.lines.Line2D at 0x2b15e0cffd60>]
<matplotlib.legend.Legend at 0x2b15e0b7a8b0>